CD3×5T4 In Vitro Activation and Cytotoxicity QSP
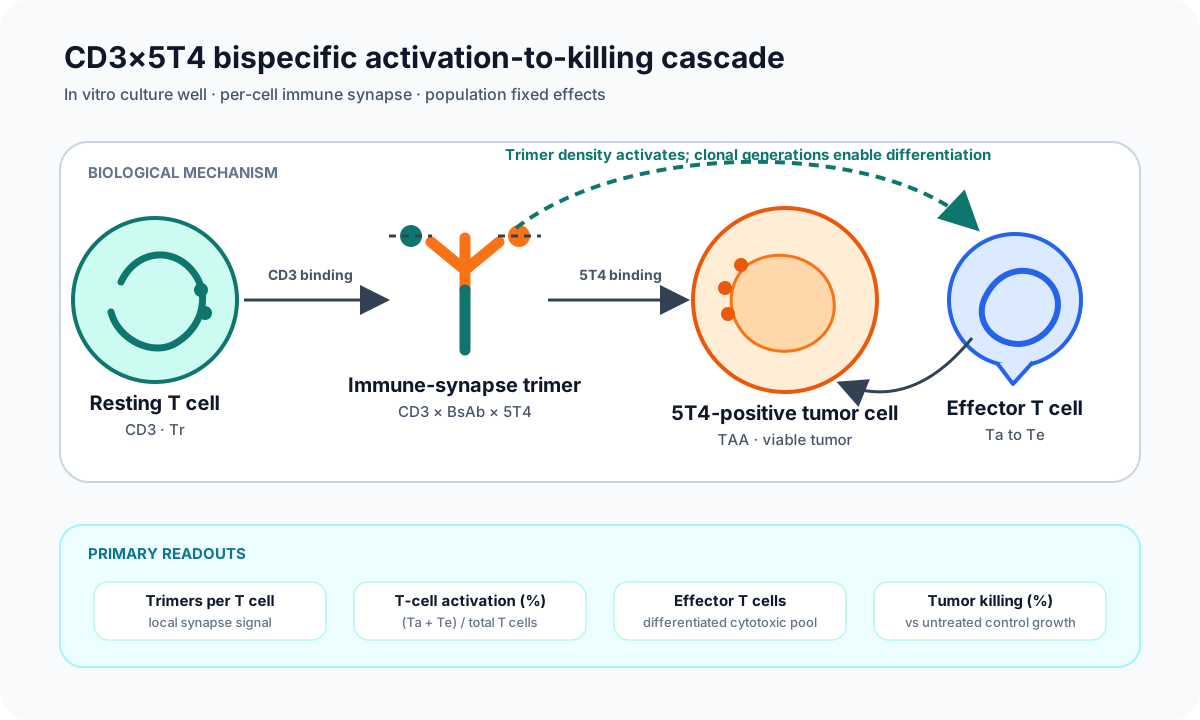
Fixed-effect in vitro model linking CD3×5T4 immune-synapse formation to T-cell activation, differentiation, and delayed tumor-cell killing.
An In Vitro Quantitative Systems Pharmacology Platform for Characterizing CD3-Bispecific Antibody-Mediated T-Cell Activation and Tumor Cell Cytotoxicity ↗The AAPS Journal
Exploration notes · What are you exploring?
Notes stay on this browser.
MDA-MB-468 untreated, E:T 4:1
Null-control culture with 16,000 tumor cells and 64,000 resting T cells, matching the referenced assay setup.
Observation window
0–72 hour
Starting configuration
Study readouts
Study purpose and interpretation limits
What this study explores
- Does the no-drug culture preserve zero trimer, activation, effector differentiation, and drug-attributable cytotoxicity?
Interpretation limits
- This is an in vitro null control, not a clinical no-treatment prediction.
- Natural T-cell loss and tumor proliferation remain active.
- Zero drug-attributable killing is evaluated against the parallel untreated tumor state.
No starting example is available for this configuration.
Biology
Links per-cell CD3×5T4 trimer formation to resting-to-activated-to-effector T-cell dynamics and three-stage apoptotic tumor-cell loss across drug affinity, concentration, antigen density, and effector-to-target ratio.
Assumptions & evidence
Assumptions & limitations
- The authors did not deposit the pooled 48 activation and 1525 cytotoxicity observations.
- The population-modeling environment project, culture-level random effects, and residual-model input rows were not deposited.
- Population fixed effects and disclosed covariate-group values are implemented; stochastic between-culture variability is not.
- Paper figures do not provide machine-readable coordinates, so curated scenarios are source-aligned mechanistic probes rather than strict figure reproductions.
- This is an in vitro assay model and must not be interpreted as a clinical dose, safety, or efficacy model.
- This is an in vitro null control, not a clinical no-treatment prediction.
- Natural T-cell loss and tumor proliferation remain active.
- Zero drug-attributable killing is evaluated against the parallel untreated tumor state.
- The trajectory uses reported population fixed effects and is not an individual-culture prediction.
- Raster-digitized Figure 2, 3, 6, and 7d comparators support private pointwise reproduction, but repeated figure renderings are non-independent and do not replace source arrays or culture-level donor records.
- This assay concentration must not be converted into a clinical dose recommendation.
- Compare this condition with the E:T 4:1 and 8:1 scenarios as an assay-design sensitivity.
- The model's R_ET factor makes per-cell synapse kinetics depend dynamically on both T-cell and tumor-cell pools.
- The result is not a clinical immune-cell infiltration prediction.
- Interpret per-cell trimer and aggregate trimer load together.
- This is a source-aligned assay condition, not a patient-level tumor microenvironment.
- Raster-digitized Figure 5, 6, and 7d endpoint comparators support private pointwise reproduction, but they are repeated renderings of one assay observation rather than independent validations.
- Compare this condition with the E:T 1:1, 4:1, and 8:1 scenarios.
- The result is an in vitro fixed-effect assay reconstruction, not a patient immune-infiltration prediction.
- The published concentration grid was recovered by figure alignment and remains explicitly provenance-labeled.
- The no-donor category maps to donor group 2 as disclosed in Supplement Table S4.
- This comparison changes several measured or estimated cell-line attributes and is not a single-parameter causal attribution.
- No tumor-type clinical efficacy inference is supported.
- The 16 nM 3D and 174 molecules/cell 2D KD values are paired measured endpoint values.
- Affinity can alter both potency and hook-region behavior; do not assume monotonic benefit at every concentration.
- This is candidate-design exploration in an in vitro model, not clinical optimization.
- Supplement Table S2 confirms the condition family, but the requested figures do not expose its exact observed endpoint at 6.86 nM.
- The no-donor category maps to donor group 2.
- Treat the trajectory as source-aligned and source-limited, not pointwise paper-validated.
- The cell-line bundle changes antigen, growth, activation threshold, and killing susceptibility together.
- The no-donor fixed effect is donor group 2.
- Do not infer clinical pancreatic-tumor efficacy.
- The paper uses both EPLC-272H and EPLC272H spellings; this scenario uses the Table S1 spelling.
- Do not attribute the response to antigen abundance alone.
- The cell-line killing group is a fitted categorical covariate and is not derived from 5T4 abundance.
- Do not infer clinical esophageal-tumor efficacy.
Parameter origins
- Released executable model definition; exact publication locator not reported
- Yuan 2026 Supplement Table S5
- Yuan 2026 Table II population estimate
- Yuan 2026 Table I measured construct endpoints
- Yuan 2026 Supplement Tables S4-S5
Validation & references
The implementation has validation evidence, but unavailable source material limits full reproduction.
An In Vitro Quantitative Systems Pharmacology Platform for Characterizing CD3-Bispecific Antibody-Mediated T-Cell Activation and Tumor Cell Cytotoxicity ↗Available reference curves can be added to the plot when their scenario, readout, time and units match.
Model details
33 parameters · 17 states · 17 equations · 18 derived outputs
Classification & API access
- Therapeutic
- DuoBody-CD3x5T4, bsIgG1-CD3x5T4
- Modality
- Bispecific antibody / T-cell engager
- Target
- CD3, 5T4
- Disease / scope
- In vitro solid-tumor cell-line assay (not disease-specific)
| Parameter | Default | Unit | Description |
|---|---|---|---|
Activated t cell doubling timeDT_Ta_hr | 12 | hr | Activated t cell doubling time coefficient used by the released system of model equations. |
Tumor cell doubling timeDT_tumor_hr | 40 | hr | MDA-MB-468 default. |
Trimer threshold for half-maximal activationEC50_activation_trimers_per_tcell | 2.13 | molecule/cell | MDA-MB-468 cell-line group 3 value. |
Generation count for half maximal differentiationEC50_differentiation_generations | 3 | dimensionless | Generation count for half maximal differentiation at which the corresponding modeled effect reaches half of its maximum. |
Aggregate trimer threshold for half-maximal killingEC50_killing_total_trimers | 7098 | molecule | Aggregate trimer load across effector T cells producing half-maximal per-effector killing drive. |
T cell activation hill coefficientGamma_activation | 0.623 | dimensionless | T cell activation hill coefficient coefficient used by the released system of model equations. |
Tumor killing hill coefficientGamma_killing | 1.63 | dimensionless | Tumor killing hill coefficient governing loss, degradation, or removal in the modeled biological process. |
Activated t cell half-lifeHL_Ta_hr | 48 | hr | Activated t cell half-life coefficient used by the released system of model equations. |
Effector t cell half-lifeHL_Te_hr | 48 | hr | Effector t cell half-life coefficient used by the released system of model equations. |
Resting t cell half-lifeHL_Tr_hr | 168 | hr | Resting t cell half-life coefficient used by the released system of model equations. |
CD3-arm 2D dissociation constant — high-affinity endpointKD_CD3_2D_high_molecules_per_cell | 11088 | molecules/cell | CD3-arm 2D dissociation constant — high-affinity endpoint describing equilibrium binding affinity in the modeled interaction. |
CD3-arm 2D dissociation constant — low-affinity endpointKD_CD3_2D_low_molecules_per_cell | 174 | molecules/cell | CD3-arm 2D dissociation constant — low-affinity endpoint describing equilibrium binding affinity in the modeled interaction. |
Measured high CD3-arm 3D dissociation endpointKD_CD3_3D_high_nM | 683 | nM | Measured high CD3-arm 3D dissociation endpoint describing equilibrium binding affinity in the modeled interaction. |
Measured low CD3-arm 3D dissociation endpointKD_CD3_3D_low_nM | 16 | nM | Measured low CD3-arm 3D dissociation endpoint describing equilibrium binding affinity in the modeled interaction. |
CD3-arm 3D dissociation constantKD_CD3_3D_nM | 683 | nM | DuoBody-CD3x5T4 value; the high-affinity bsIgG1 variant is 16 nM. Values between the endpoints are exploratory and values outside them are outside this runtime contract. |
5T4-arm 2D dissociation constantKD_TAA_2D_molecules_per_cell | 27 | molecules/cell | 5T4-arm 2D dissociation constant describing equilibrium binding affinity in the modeled interaction. |
5T4-arm 3D dissociation constantKD_TAA_3D_nM | 3 | nM | 5T4-arm 3D dissociation constant describing equilibrium binding affinity in the modeled interaction. |
Maximum T-cell activation rateMax_activation_per_hr | 0.0106 | 1/hr | Upper rate of trimer-dependent resting-to-activated T-cell conversion in the fixed-effect model. |
Maximum t cell differentiation rateMax_differentiation_per_hr | 0.268 | 1/hr | Maximum t cell differentiation rate coefficient used by the released system of model equations. |
Maximum per-effector tumor killing rateMax_kill_per_effector_hr | 0.000013 | 1/(hour*cell) | MDA-MB-468 cell-line group 4 and no-donor/donor group 2 value. |
Baseline CD3 abundancebase_CD3_molecules_per_tcell | 30000 | molecule/cell | Baseline CD3 abundance coefficient used by the released system of model equations. |
Baseline 5 T4 abundancebase_TAA_molecules_per_tumor | 31582 | molecule/cell | MDA-MB-468 default from Supplement Table S1. |
CD3 side complex internalization rateint_CD3_per_hr | 0.066 | 1/hr | CD3 side complex internalization rate coefficient used by the released system of model equations. |
5 T4 side complex internalization rateint_TAA_per_hr | 0.066 | 1/hr | 5 T4 side complex internalization rate coefficient used by the released system of model equations. |
CD3 degradation ratekdeg_CD3_per_hr | 0.066 | 1/hr | CD3 degradation rate governing loss, degradation, or removal in the modeled biological process. |
5 T4 degradation ratekdeg_TAA_per_hr | 0.066 | 1/hr | 5 T4 degradation rate governing loss, degradation, or removal in the modeled biological process. |
CD3 dissociation ratekoff_CD3_per_hr | 72 | 1/hr | CD3 dissociation rate governing molecular dissociation in the binding model. |
5 T4 dissociation ratekoff_TAA_per_hr | 3.774 | 1/hr | 5 T4 dissociation rate governing molecular dissociation in the binding model. |
Apoptosis transit ratektr_apoptosis_per_hr | 1 | 1/hr | Apoptosis transit rate coefficient used by the released system of model equations. |
Molecule to medium concentration conversionmolecule_to_nM | 1.1e-11 | nM/molecule | Molecule to medium concentration conversion coefficient used by the released system of model equations. |
Immune synapse areasynapse_area_um2 | 12.56 | um^2 | Immune synapse area coefficient used by the released system of model equations. |
T cell radiustcell_radius_um | 3.5 | um | T cell radius coefficient used by the released system of model equations. |
Tumor cell radiustumor_radius_um | 10 | um | Tumor cell radius coefficient used by the released system of model equations. |
Related models
Feedback: helpdesk@unibiointelligence.com.