RANKL-directed exposure and bone-density turnover
Explore subcutaneous antibody absorption, apparent two-compartment disposition and quasi-steady-state RANKL binding linked to empirical bone-density turnover. Conditional fixed effects do not establish population behavior or biosimilarity.
Population pharmacokinetics/pharmacodynamics analysis confirming biosimilarity of SB16 to reference denosumab ↗Exploration notes · What are you exploring?
Notes stay on this browser.
Alternate treatment-coefficient context
What changes when the fitted treatment clearance multiplier is applied to the same dose and covariate context? Fixed-effect exploration; no population or biosimilarity inference.
Biology
Explore subcutaneous antibody absorption, apparent two-compartment disposition and quasi-steady-state RANKL binding linked to empirical bone-density turnover. Conditional fixed effects do not establish population behavior or biosimilarity.
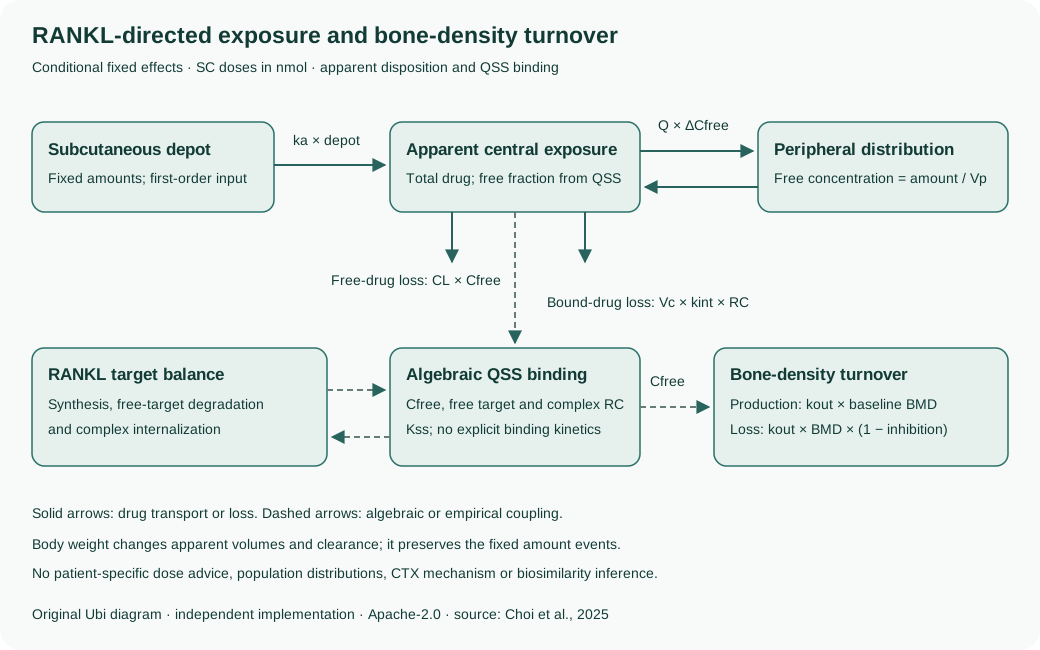
States & equation dependencies
Assumptions & evidence
Assumptions & limitations
- Deterministic fixed-effect trajectories are distinct from population medians, prediction intervals and formal biosimilarity inference.
- Dose events contain 408.1632653061224 nmol, representing 60 mg under the retained 147 kDa molecular-weight assumption. Physical amount readouts are in nmol; equivalent events use dimensionless numerical coordinates. No implicit milligram conversion is performed.
- Population context is categorical and coupled to the initial target baseline; changing the flag requires coordinated initial-state changes.
- Baseline target and BMD parameters are coupled to explicit initial states and are excluded from independent analysis axes.
- Disposition volumes and clearances are apparent quantities; target binding is algebraic QSS, not an explicit association/dissociation system.
- Healthy-volunteer BMD is an unobserved model extrapolation; its scenario exposes PK only.
- BMD change is relative to model baseline and cumulative exposure starts at simulation time zero; neither is automatically a clinical effect estimate or interval AUCtau.
- Five retained source conflicts, original individual data, population-modeling environment likelihood/random effects, population predictions, pcVPC and source-figure reproduction remain unresolved.
- Table 3 weight exponents and retained amount-form equations are explicit conventions, not adjudicated resolutions of the source conflicts.
- The four non-weight control bounds are exploratory 0.5–1.5× default ranges; no patient distribution or parameter uncertainty is implied.
- The Hill state derivative is singular at zero; the existing runtime uses numerical Jacobian boundary regularization. No sensitivity or fitting qualification is asserted.
Parameter origins
- Discussion gives 2.1 days
- Discussion gives 3.7 days
- Derived from Table 3
- pdfinfo on fetched article PDF
- Discussion
- Table 4
- Section 2.2
- Table 3 covariate model and Table S1 total mean near 64 kg
- TheraSAbDab strict citation/year queue row 629
- Table 3
- mAb convention for concentration-unit bridge
- Derived
- Derived scenario convention
- Table 1/Figure 9
- Explicit exact linear nondimensionalization: physical amount = coordinate * 1e-60 nmol.
- PMC HTML image links
- Table 4/Eq. 10
- Eq. 10 derived from Table 4
- Eq. 9
- Table 3 and Eq. 7
- Table 1
- tables/pmc_tables_summary.json
- PMC metadata
- PubMed metadata
- metadata/europepmc_preprint_title.json
- Article metadata
- Eq. 7 derived from Table 3
- PMC supplementary-material link
- Table 5
- Section 3.3
- Generated validation control
- Section 2.6
Validation & references
One or more implementation checks are available; this is not a claim of full model reproduction.
Population pharmacokinetics/pharmacodynamics analysis confirming biosimilarity of SB16 to reference denosumab ↗Available reference curves can be added to the plot when their scenario, readout, time and units match.
Model details
118 parameters · 7 states · 7 equations · 142 derived outputs
Classification & API access
- Therapeutic
- Denosumab
- Modality
- Monoclonal antibody
- Target
- RANKL, TNFSF11, CD254, TRANCE, OPGL, ODF
- Disease / scope
- Healthy volunteers and postmenopausal women with osteoporosis
| Parameter | Default | Unit | Description |
|---|---|---|---|
Absorption half-life hvabsorption_half_life_hv_day | 2.0629380373807895 | day | HV absorption half-life. |
Absorption half-life pmoabsorption_half_life_pmo_day | 3.7027092978629557 | day | PMO absorption half-life. |
Absorption half-life pmoabsorption_half_life_pmo_h | 88.86502368428528 | h | log(2)/ka_pmo. |
Article pdf pagesarticle_pdf_pages | 17 | 1 | Frontiers/PMC article PDF page count. |
Asian AUC decrease percentasian_auc_decrease_percent | 19 | percent | AUC decrease in Asian subjects relative to Caucasians. |
Black AUC decrease percentblack_auc_decrease_percent | 11 | percent | AUC decrease in Black subjects relative to Caucasians. |
BMD0 g CM2bmd0_g_cm2 | 0.76 | g/cm**2 | Baseline lumbar spine BMD. |
BMD0 iiv percentbmd0_iiv_percent | 59.85 | percent | Inter-individual variability for BMD0. |
Bmd measurementsbmd_measurements | 1716 | 1 | Lumbar spine BMD measurements. |
Bmd response 45kg percentbmd_response_45kg_percent | 7.11 | percent | BMD response for 45 kg subgroup. |
Bmd response 64kg percentbmd_response_64kg_percent | 6.66 | percent | BMD response for 64 kg subgroup. |
Bmd response 90kg percentbmd_response_90kg_percent | 5.54 | percent | BMD response for 90 kg subgroup. |
Bmd response asian percentbmd_response_asian_percent | 5.93 | percent | BMD response for Asian subgroup. |
Bmd response black percentbmd_response_black_percent | 6.15 | percent | BMD response for Black subgroup. |
Bmd response caucasian percentbmd_response_caucasian_percent | 6.45 | percent | BMD response for Caucasian subgroup. |
Body weightbody_weight_kg | 64 | kg | Reference body weight for PMO simulations. |
Citation rankcitation_rank | 945 | 1 | Citation-priority queue rank. |
Clearance apparentcl_apparent_L_h | 0.006 | L/h | Race-specific apparent clearance used by the current scenario. |
Clearance asiancl_asian_L_h | 0.0074 | L/h | Clearance in Asian subjects. |
Clearance blackcl_black_L_h | 0.0069 | L/h | Clearance in Black subjects. |
Clearance caucasiancl_caucasian_L_h | 0.006 | L/h | Clearance in Caucasian subjects. |
Clearance iiv percentcl_iiv_percent | 26.39 | percent | Inter-individual variability for CL/F. |
Corr peripheral distribution volume clearancecorr_vp_cl | 0.43 | 1 | Correlation between Vp/F and CL/F IIV. |
Denosumab mw gdenosumab_mw_g_mol | 147000 | g/mol | Approximate denosumab molecular weight for mg-to-nmol conversion. |
Dose 60mgdose_60mg_nmol | 408.1632653061224 | nmol | 60 mg converted to nmol. |
Dosing intervaldosing_interval_h | 4380 | h | Six months represented as 365/2 days for simulation. |
Dosing interval monthsdosing_interval_months | 6 | months | Repeated-dose interval. |
Drug-amount coordinate scaledrug_amount_nmol_per_coordinate | 1e-60 | nmol | Fixed physical amount per dimensionless numerical coordinate; not a biological parameter. |
Figure image countfigure_image_count | 9 | count | Fetched PMC figure images. |
Hill coeffhill_coeff | 0.17 | dimensionless | Hill coefficient. |
IC50 iiv percentic50_iiv_percent | 9.52 | percent | Inter-individual variability for IC50. |
Half-maximal inhibitory concentrationic50_nM | 6.92 | nmol/L | Concentration producing 50 percent of Imax. |
Imax fimax_f | -1.75 | 1 | Logit-transformed fractional maximum inhibitory effect. |
Imax fractionimax_fraction | 0.1480471980316895 | 1 | exp(ImaxF)/(1+exp(ImaxF)). |
Implementation priority scoreimplementation_priority_score | 14 | 1 | Queue implementation priority score. |
Absorption rate hvka_hv_h | 0.014 | 1/h | Absorption rate constant for healthy subjects. |
Absorption rate iiv percentka_iiv_percent | 56.57 | percent | Inter-individual variability for ka. |
Absorption rate pmoka_pmo_h | 0.0078 | 1/h | Absorption rate constant for PMO patients. |
Kin bmd derived g CM2kin_bmd_derived_g_cm2_h | 0.0001368 | g/cm**2/h | kout*BMD0 using Table 4 values. |
Kin bmd g CM2kin_bmd_g_cm2_h | 0.00014 | g/cm**2/h | BMD production rate shown in Table 4; derived by kout*BMD0. |
Target internalization ratekint_h | 0.022 | 1/h | Denosumab-target complex internalization rate. |
Kint iiv percentkint_iiv_percent | 7.88 | percent | Inter-individual variability for kint. |
Turnover loss rate bmdkout_bmd_h | 0.00018 | 1/h | Lumbar spine BMD elimination rate. |
Quasi-steady-state binding constant iiv percentkss_iiv_percent | 58.12 | percent | Inter-individual variability for Kss. |
Quasi-steady-state binding constantkss_nM | 1.56 | nmol/L | QSS equilibrium constant. |
Ksyn iiv percentksyn_iiv_percent | 22.46 | percent | Inter-individual variability for reported ksyn. |
Ksyn reportedksyn_reported_nM_h | 0.01 | nmol/L/h | Reported target synthesis value; table unit is ambiguous, Eq. 7 gives ksyn=R0*kdeg. |
Lloqlloq_ng_ml | 20 | ng/mL | Denosumab assay LLOQ. |
Modeled subjectsmodeled_subjects | 615 | subjects | Subjects included in PK modeling. |
Denosumab amount conversionnmol_per_mg_denosumab | 6.802721088435374 | nmol/mg | 1e6 / molecular weight. |
PD additive error g CM2pd_additive_error_g_cm2 | 0.02 | g/cm**2 | PD additive residual error. |
PHASE1 single dosephase1_single_dose_mg | 60 | mg | Phase I single SC dose. |
PHASE1 subjectsphase1_subjects | 168 | subjects | Phase I healthy-volunteer subjects. |
PHASE3 den then den subjectsphase3_den_then_den_subjects | 101 | subjects | Phase III EU-DEN continuation subjects. |
PHASE3 den then SB16 subjectsphase3_den_then_sb16_subjects | 100 | subjects | Phase III EU-DEN to SB16 transition subjects. |
PHASE3 repeated dosephase3_repeated_dose_mg | 60 | mg | Phase III SC dose at months 0, 6, and 12. |
PHASE3 SB16 subjectsphase3_sb16_subjects | 225 | subjects | Phase III SB16 arm subjects. |
PHASE3 subjectsphase3_subjects | 456 | subjects | Phase III PMO patients. |
PK additive errorpk_additive_error_nM | 0.72 | nmol/L | PK additive residual error. |
PK proportional errorpk_proportional_error | 0.07 | 1 | PK proportional residual error. |
Pmc html table countpmc_html_table_count | 20 | count | HTML table-like blocks extracted from PMC. |
Pmcid numericpmcid_numeric | 12403037 | 1 | PMCID numeric component. |
Pmid numericpmid_numeric | 40904558 | 1 | PMID. |
Population pmo flagpopulation_pmo_flag | 1 | 1 | Use PMO ka/Q/R0 when 1; HV values when 0. |
Postdose blq samplespostdose_blq_samples | 1129 | 1 | Post-dose BLQ samples retained as MDV=1. |
Postdose quantifiable samplespostdose_quantifiable_samples | 3133 | 1 | Quantifiable post-dose serum samples. |
Postdose samplespostdose_samples | 4262 | 1 | Post-dose serum samples. |
Preprint hit countpreprint_hit_count | 0 | count | EuropePMC title preprint search hits. |
Publicationpublication_year | 2025 | year | Publication year. |
Q hvq_hv_L_h | 1.13 | L/h | Inter-compartment clearance for healthy subjects. |
Q iiv percentq_iiv_percent | 295.99 | percent | Inter-individual variability for Q/F. |
Q pmoq_pmo_L_h | 0.2 | L/h | Inter-compartment clearance for PMO patients. |
Queue cited by countqueue_cited_by_count | 0 | count | Queue cited-by count. |
R0 hvr0_hv_nM | 0.98 | nmol/L | Baseline RANKL in healthy volunteers. |
R0 iiv percentr0_iiv_percent | 158.3 | percent | Inter-individual variability for R0. |
R0 pmor0_pmo_nM | 15.23 | nmol/L | Baseline RANKL in PMO patients. |
Rankl degradation rate from ksyn over R0 pmorankl_kdeg_from_ksyn_over_r0_pmo_h | 0.0006565988181221273 | 1/h | 0.01 / 15.23 to satisfy Eq. 7 at PMO baseline. |
Reference weightreference_weight_kg | 64 | kg | Reference body weight in covariate equations. |
Serum concentration recordsserum_concentration_records | 6583 | 1 | Total serum denosumab concentration records. |
Steady state vdsteady_state_vd_L | 7.64 | L | Vc+Vp apparent steady-state volume. |
Supplement docx countsupplement_docx_count | 1 | 1 | Real DOCX supplement count. |
Den AUC tau sstable5_den_auc_tau_ss_nM_h | 53731 | nmol*h/L | DEN median AUCtau,ss. |
Den AUC tau ss pi hightable5_den_auc_tau_ss_pi_high_nM_h | 87790 | nmol*h/L | DEN AUCtau,ss 90 percent PI high. |
Den AUC tau ss pi lowtable5_den_auc_tau_ss_pi_low_nM_h | 33706 | nmol*h/L | DEN AUCtau,ss 90 percent PI low. |
Den bmd change percenttable5_den_bmd_change_percent | 6.59 | percent | DEN BMD change from baseline. |
Den bmd change pi high percenttable5_den_bmd_change_pi_high_percent | 7.58 | percent | DEN BMD change 90 percent PI high. |
Den bmd change pi low percenttable5_den_bmd_change_pi_low_percent | 4.96 | percent | DEN BMD change 90 percent PI low. |
Den cmaxtable5_den_cmax_nM | 40.29 | nmol/L | DEN median Cmax. |
Den cmax pi hightable5_den_cmax_pi_high_nM | 80.45 | nmol/L | DEN Cmax 90 percent PI high. |
Den cmax pi lowtable5_den_cmax_pi_low_nM | 26.04 | nmol/L | DEN Cmax 90 percent PI low. |
Den tmaxtable5_den_tmax_h | 267 | h | DEN median Tmax. |
Den tmax pi hightable5_den_tmax_pi_high_h | 505 | h | DEN Tmax 90 percent PI high. |
Den tmax pi lowtable5_den_tmax_pi_low_h | 59 | h | DEN Tmax 90 percent PI low. |
SB16 AUC tau sstable5_sb16_auc_tau_ss_nM_h | 55040 | nmol*h/L | SB16 median AUCtau,ss. |
SB16 AUC tau ss pi hightable5_sb16_auc_tau_ss_pi_high_nM_h | 85011 | nmol*h/L | SB16 AUCtau,ss 90 percent PI high. |
SB16 AUC tau ss pi lowtable5_sb16_auc_tau_ss_pi_low_nM_h | 33625 | nmol*h/L | SB16 AUCtau,ss 90 percent PI low. |
SB16 bmd change percenttable5_sb16_bmd_change_percent | 6.59 | percent | SB16 BMD change from baseline. |
SB16 bmd change pi high percenttable5_sb16_bmd_change_pi_high_percent | 7.52 | percent | SB16 BMD change 90 percent PI high. |
SB16 bmd change pi low percenttable5_sb16_bmd_change_pi_low_percent | 4.9 | percent | SB16 BMD change 90 percent PI low. |
SB16 cmaxtable5_sb16_cmax_nM | 40.66 | nmol/L | SB16 median Cmax. |
SB16 cmax pi hightable5_sb16_cmax_pi_high_nM | 77.5 | nmol/L | SB16 Cmax 90 percent PI high. |
SB16 cmax pi lowtable5_sb16_cmax_pi_low_nM | 26.9 | nmol/L | SB16 Cmax 90 percent PI low. |
SB16 tmaxtable5_sb16_tmax_h | 259 | h | SB16 median Tmax. |
SB16 tmax pi hightable5_sb16_tmax_pi_high_h | 530 | h | SB16 Tmax 90 percent PI high. |
SB16 tmax pi lowtable5_sb16_tmax_pi_low_h | 52 | h | SB16 Tmax 90 percent PI low. |
Typical weight clearancetheta_weight_cl | 0.93 | dimensionless | Body-weight exponent on CL/F. |
Typical weight central distribution volumetheta_weight_vc | 1.5 | dimensionless | Body-weight exponent on Vc/F. |
Typical weight peripheral distribution volumetheta_weight_vp | 0.52 | dimensionless | Body-weight exponent on Vp/F. |
Treatment clearance multipliertreatment_cl_multiplier | 1 | ratio | Treatment multiplier on clearance; SB16 uses 0.9982. |
Treatment clearance ratio SB16 to dentreatment_cl_ratio_sb16_to_den | 0.9982 | ratio | CL/F ratio for SB16 to DEN when treatment retained as covariate. |
Validation run noncevalidation_run_nonce | 0 | dimensionless | Validation nonce to avoid stale exact replay jobs. |
Central distribution volume fvc_f_L | 1.58 | L | Apparent central volume. |
Central distribution volume f iiv percentvc_f_iiv_percent | 61.69 | percent | Inter-individual variability for Vc/F. |
Peripheral distribution volume fvp_f_L | 6.06 | L | Apparent peripheral volume. |
Peripheral distribution volume f iiv percentvp_f_iiv_percent | 15.55 | percent | Inter-individual variability for Vp/F. |
Vpc replicatesvpc_replicates | 1000 | 1 | VPC simulations generated in population-modeling environment. |
Weight 45kg AUC increase percentweight_45kg_auc_increase_percent | 45 | percent | AUC increase at 45 kg relative to 64 kg. |
Weight 90kg AUC decrease percentweight_90kg_auc_decrease_percent | 39 | percent | AUC decrease at 90 kg relative to 64 kg. |
Related models
Feedback: helpdesk@unibiointelligence.com.
